The Australian Communications Media Authority (ACMA) has released its report into telco complaints over the 2018-2019 financial year – and while customer satisfaction appears to be on the rise, there’s still several areas where providers are falling short.
Compiled from data provided by Australian telcos, the ACMA report shows that mobile and internet providers received around 1.4 million complaints over the last financial year. The good news is that complaints have dropped each quarter, with both telco-resolved issues and those escalated to the Telecommunications Industry Ombudsman (TIO) decreasing overall.
Telco complaints on the decline
The report assesses complaints made to 30 Australian telcos, including both mobile and broadband service providers. Data collected includes details of complaints, technology used by the complaining customer, and the time taken by a provider to resolve the issue, and data is shared between selected telcos to compare their complaint resolution performance across the industry.
According to the ACMA, total complaints declined significantly in the June 2019 quarter, with 97 complaints recorded per 10,000 services in operation. This is a 17.1% drop when compared to March 2019, which had an average of 117 complaints per 10,000 services.
Complaints each quarter (per 10,000 services in operation):
- September 2018 quarter: 122
- December 2018 quarter: 124
- March 2019 quarter: 117
- June 2019 quarter: 97
Over half of the 30 surveyed providers reported receiving 30 or fewer complaints per 10,000 services in the June 2019 quarter, while eleven telcos received at least 50 complaints per 10,000 services in the same period. Overall, while customer complaints stayed steady for much of 2018-2019, there was a clear drop in June 2019 period, with a significant amount of providers reporting lower-than-average numbers of complaints.
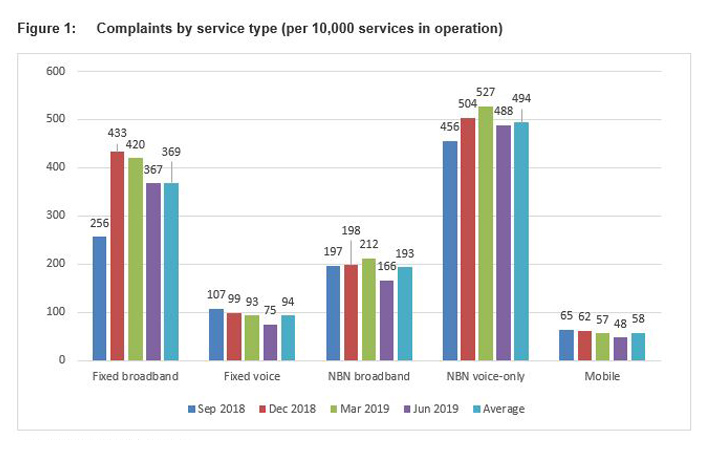
While mobile services represent the largest number of telco products used by Australians (with more than 21.8 million recorded in the June 2019 quarter), it’s also the area with the lowest complaint rate. As of June, telcos logged just 48 complaints for every 10,000 operating mobile services, a serious drop from September’s figure of 65 complaints per 10,000 services.

NBN vs. other broadband
Although more Australians are moving to the NBN, complaints about the network are still outweighed by those concerning non-NBN fixed line broadband. On average, telcos received 193 complaints per 10,000 NBN services throughout the 2018-2019 period; in comparison, non-NBN fixed broadband accounted for 369 complaints per 10,000 services.
The larger rate of complaints made about non-NBN fixed networks can generally be attributed to the older technology types used to provide these services. However, new networks also present their own challenges, particularly as more customers switch from older ADSL and cable services to NBN connections.
Overall NBN complaints have declined, even when broken down by technology type: in particular, Fibre to the Curb connections have showed major improvements, dropping from 744 complaints per 10,000 services in September 2018, to 282 per 10,000 services in June 2019.
Average complaints by access technology (per 10,000 services in operation) across 2018-2019 financial year:
- Hybrid fibre coaxial (HFC): 324
- Fibre-to-the-curb (FTTC): 475
- Fibre-to-the-building (FTTB): 250
- Fibre-to-the-node (FTTN): 182
- Fibre-to-the-premises (FTTP): 144
- Fixed wireless: 148
- Satellite: 54
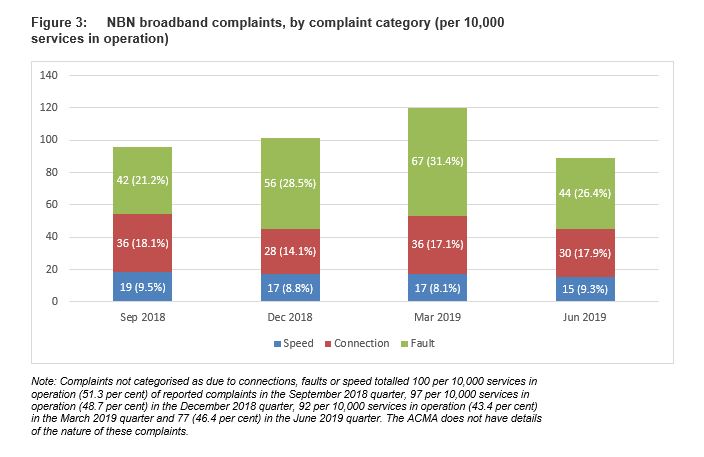
Complaints were divided into four categories: speed, connection, general faults, and other. Surprisingly, speed issues accounted for less than 10% of total complaints each quarter, averaging out at 15 complaints per 10,000 services in June of 2019. Speed, connection, and fault totals are listed in the below table; other complaint types are discussed below.

Most complaints fall under the ‘other’ category, with close to half of all recorded NBN complaints each quarter unable to be categorised as a speed, connection, or fault issue. These complaints may include problems such as billing disputes or customer service issues, but complaints in this category have also dropped over the 12-month recording period (down from 100 complaints per 10,000 services in September 2018, to 77 per 10,000 in June 2019).
In general, complaints have declined across almost all mobile and broadband categories, with one major exception. Voice-only NBN services have a far higher complaint rate than NBN broadband, or even voice services delivered over other fixed networks. NBN voice-only accounted for 488 complaints per 10,000 services in June 2019, compared to just 94 complaints per 10,000 services for other fixed line voice connections in the same quarter.
If you’re on a voice-only NBN plan, at least complaint resolution times are turning around. The ACMA also found that the average time-frame in which telcos resolve their customer complaints has slightly decreased, dropping from six days in September 2018 to five days in June 2019.
Optus not included
The ACMA’s research reflects much of the TIO’s own recently-published annual report, which covered complaints that were escalated to the Ombudsman in the same 2018-2019 financial year. Telco complaints are dropping, but there’s still issues to resolve; of particular interest to the ACMA is the high rate of voice-only NBN complaints.
One problem the ACMA has acknowledged is the important role telcos themselves play in recording and assessing complaint data. Due to concerns over data accuracy, the ACMA has excluded Optus from its 2018-2019 report, instead ordering the provider to conduct an external audit of its record-keeping.
Whether the omission of Australia’s second-largest telco has skewed the overall results of this year’s report remains to be seen. While Optus is absent for now, the ACMA has stated that the telco’s data will be included in future reports only when the Authority can be ‘confident of its accuracy’.


Share this article